This webpage was produced as an assignment for Genetics 564, an undergraduate capstone course at UW-Madison.
Transcriptomics
What is transcriptomics?
The study of genes is called genetics. The study of all genes in a cell simultaneously: genomics. Likewise the study of all transcripts in a cell is called transcriptomics. You may be asking yourself what a transcript is at this point.
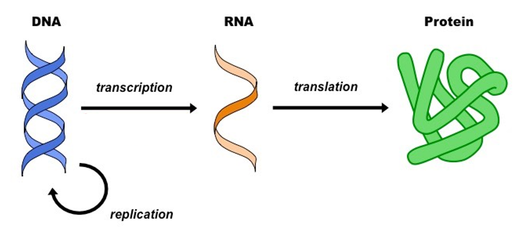
This diagram represents the central dogma of molecular biology. A transcript refers to the RNA produced after a gene in the DNA is transcribed. By looking at the number of transcripts produced for a gene, researchers gain information about the gene's expression levels. In transcriptomics the expression levels of all genes are accessed simultaneously. This allows scientist to better understand the large, complex, and interconnected network of gene expression.
How is transcriptomics studied?
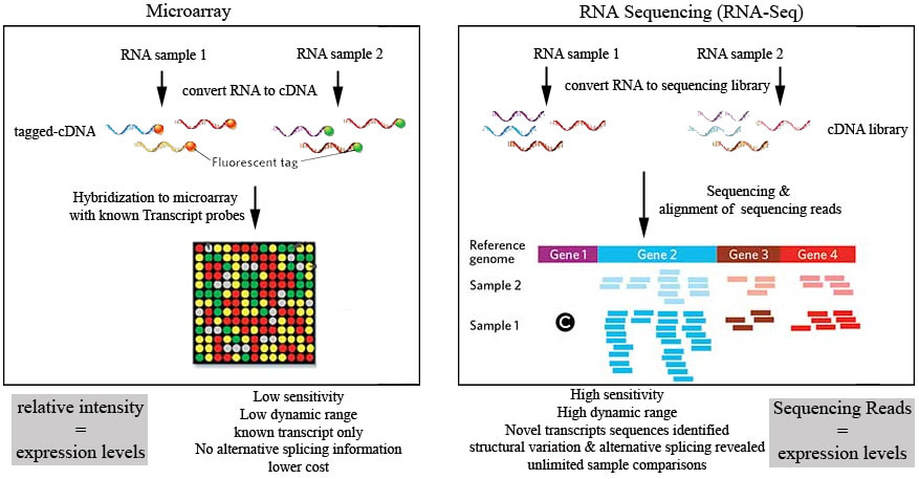
Micro-array and RNA-sequencing work-flows
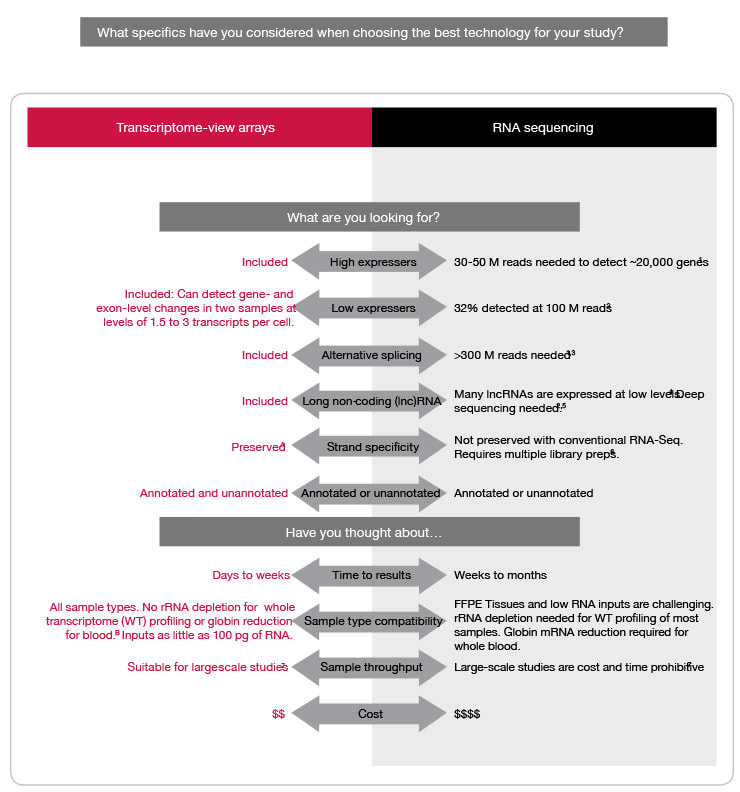
Other factors a scientist may want to consider
Interpreting assay results
|
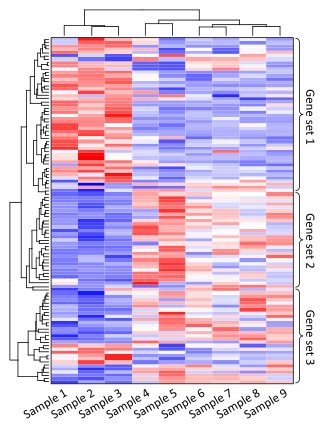
There are of course many ways of representing transcriptomic data, one of which is the expression profile. (See left). Expression profiles offer scientist a glimpse into what large trends may exist in their data. When reading an expression profile the genes will be on the horizontal axis and the changing samples/conditions/time will be on the vertical axis.
|
NIPBL transcriptomic analysis with GEO
Here I have used the GEO data repository to look at some transcriptional data of the NIPBL gene. GEO short for Gene Expression Omnibus is a genomic data repository curated by the U.S. NCBI (National Center for Biotechnology Information). The repository is composed of "sets of microarray, next-generation sequencing, and other forms of high-throughput functional genomic data submitted by the scientific community" [1].
GEO data-sets
|
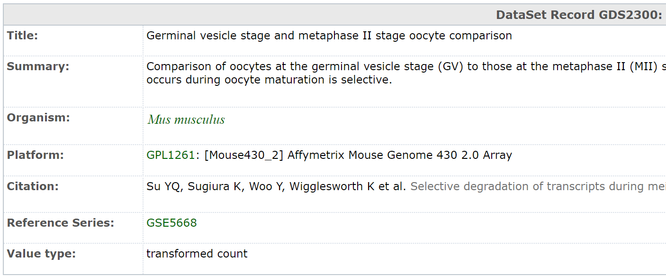
A query of the term "NIPBL" in the database yields 11,520 results. Here I have selected a data-set with a GEO profile (further described later) that appears deferentially expressed. The data-set page describes where the information (both the technology and publication information) came from, the number of samples, and a description of the experiment.
|
GEO clustering analysis
|
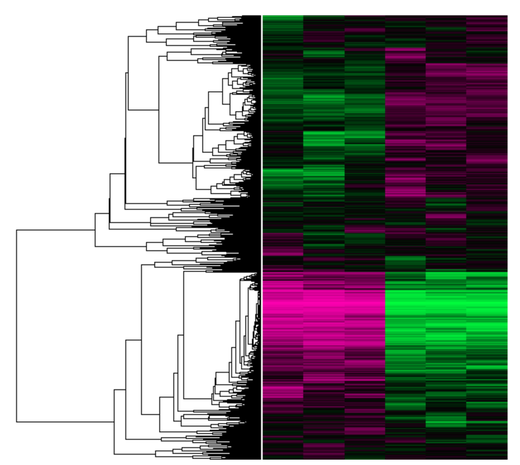
Raw data from the publication which NIPBL's GEO profile is extracted from. There are six samples, each column is representative of a sample. There are 21,702 rows in the this data-set, each row representing the expression of a gene between different samples. The "tree" to the left of the data-set represents the decisions that a clustering algorithm (specifically the UPGMA algorithm) made when choosing the placement of the rows.
|
Understanding a GEO profile
|
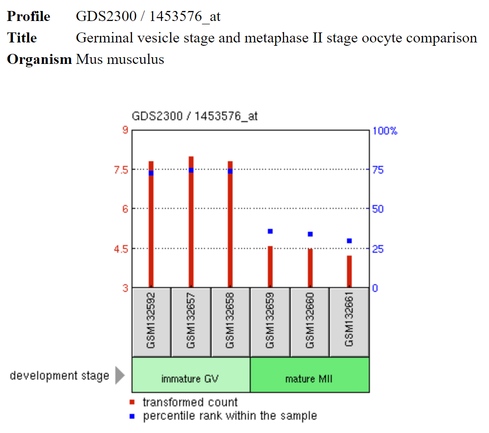
This is the NIPBL GEO profile extracted from one of the rows above.
Important to note is that the scale for the blue squares is on the right side of the profile and the scale for the red bars is on the left [3]. Blue boxes: "Where the expression of a gene falls with respect to all other genes on that array." [3] Red bars: Expression values with respect to the other NIPBL values within the profile [3]. GSM###: Name of sample. Green shaded boxes: Developmental state, disease state, etc. |
References
1.) Frequently Asked Questions - GEO - NCBI. (n.d.). Retrieved March 31, 2018, from https://www.ncbi.nlm.nih.gov/geo/info/faq.html#analyze
2.) GDS Cluster Analysis. (n.d.). Retrieved March 31, 2018, from https://www.ncbi.nlm.nih.gov/geo/gds/analyze/analyze.cgi?ID=GDS2300
3.) About GEO Profiles - GEO - NCBI. (n.d.). Retrieved March 31, 2018, from https://www.ncbi.nlm.nih.gov/geo/info/profiles.html#result
